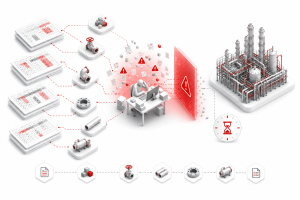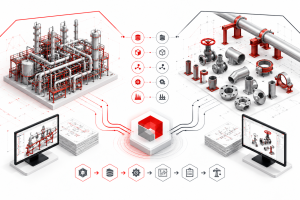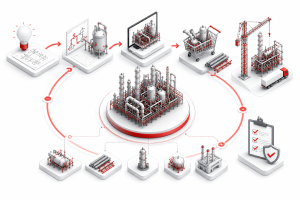




Every drawing that leaves your Octave Forte 3D (formerly Hexagon Smart 3D) environment looks correct to the person who produced it. That’s the problem. The most expensive errors in EPC plant design are never the ones an engineer catches and fixes on the spot — they’re the ones that look “almost right,” pass self-review, and travel three, four, five steps downstream before anyone notices something is wrong. By then, the fix isn’t a five-minute correction. It’s a rejected drawing package, a scrapped spool, or a wrong-grade valve sitting on a laydown yard three weeks before it’s needed.
This article is about that gap between “looks right” and “is right” — where it comes from in manual Forte 3D workflows, why traditional QA/QC can’t fully close it, and how native automation eliminates the gap at its source instead of trying to catch it later.
1. The Illusion of “Looks Correct”
Ask any Lead Piping Engineer what happens to a drawing before it’s issued, and they’ll describe a familiar sequence: the engineer builds it, checks it themselves, and sends it forward. That self-check step feels like quality control. In most cases, it catches genuine mistakes — a mislabeled valve, an obviously wrong dimension, a missing note.
What self-review cannot catch is a category of error that isn’t wrong in an obvious way. It’s wrong in a way that only becomes visible when compared against dozens of other drawings, or against a catalog record nobody is looking at, or against a physical structural member three months from now on a construction site. The drawing “looks correct” because, in isolation, it is internally consistent. The problem only exists in relation to something the reviewing engineer cannot see from where they’re sitting.
This is the category of error this article is about — not carelessness, not lack of skill, but errors that are structurally invisible to the person and process meant to catch them.
2. Why QA/QC Discipline Helps — But Has a Ceiling
To be clear upfront: rigorous QA/QC process makes a measurable difference. Firms with consistent QA/QC processes keep rework below 5% of project budget in 56% of cases, compared to only 37% of firms without such standards. That’s a real, well-documented gap, and any organization without structured design review should build one immediately.
But structured review has a ceiling, and recent industry data shows exactly where that ceiling sits. Construction rework cost clusters between 4% and 10% of total project cost across peer-reviewed studies, and design-related errors specifically have declined from a historical 1–9% of total project cost down to 1–2% in recent years as BIM and digitization have matured.
Read that trend carefully: BIM and digitization already cut design-error-driven rework by roughly half to two-thirds. That’s the leverage of better tooling. But it hasn’t gone to zero — because BIM platforms like Octave Forte 3D still require a substantial layer of manual, repetitive human work on top of the model to produce construction-ready deliverables. That manual layer is exactly where the remaining 1–2% lives, and it’s the layer that structured review alone cannot fully close, because the errors it produces are — by design — the ones that look correct.
[Internal link: “The Octave Forte 3D QA/QC Prevention Report — The 7 Most Costly Drawing Errors and How Native Automation Structurally Eliminates Them”] For the complete technical breakdown of each error category referenced in this article.
3. Five Places “Almost Right” Hides in a Forte 3D Workflow
Not every part of the Forte 3D workflow carries the same invisible-error risk. The pattern concentrates in specific tasks — the ones that are repetitive, judgment-dependent at the margins, and performed by the same person who later reviews their own work.
| Where It Hides | What “Almost Right” Looks Like | Why It’s Invisible |
| Control point values on support drawings | A dimension entered as 100.5 instead of 105.0 | Both numbers look plausible on the drawing; only the fabricator discovers the mismatch |
| Label and title placement | Label positioned slightly differently than the company standard on drawing #43 of 200 | Correct in isolation; wrong only in comparison to the other 199 drawings |
| Isometric support attachment completeness | Support position #4 of 6 quietly skipped during a long modeling session | The isometric looks complete because nothing signals a missing item |
| Catalog component specification | A material grade code that passes bulkload validation but doesn’t match the intended vendor spec | The 3D model displays a normal-looking component; the underlying data is wrong |
| Bulk pipeline attribute values | One pipeline in a 50-line batch retains its old insulation code after a spec revision | The model looks updated because 49 of 50 lines changed correctly |
In every case, the error is a partial failure inside an otherwise correct process — which is precisely what makes it resistant to a human glancing over the output and asking, “does this look right?” It does. That’s the trap.
4. The Anatomy of an Invisible Error: A Walkthrough
Consider a single, realistic scenario, traced from creation to discovery.
Week 1 — Creation. An engineer manually adds 60 control points across a batch of 15 support drawings on a Thursday afternoon. By drawing 11, fatigue has set in. One Dimension CP on drawing 12 is measured from the wrong structural reference — a plausible-looking value, off by 40mm.
Week 1 — Self-review. The same engineer reviews their own batch before submission. The value looks reasonable next to the other dimensions on the drawing. Nothing flags it. The batch is submitted.
Week 2 — QA/QC review. The client’s reviewer checks drawing formatting, completeness, and general compliance. A 40mm dimensional discrepancy against a structural reference that isn’t independently re-measured during this review stage is not something a formatting-focused QA/QC pass is designed to catch. The drawing passes.
Week 6 — Fabrication. The spool shop builds the support assembly to the drawing’s stated dimensions. The output is exactly what the drawing specified — which means it’s wrong by 40mm, exactly as the original error specified.
Week 9 — Installation. The fabricated support arrives on site and does not align with the actual structural steel position. The discrepancy is now unmistakable — but it took eight weeks and a physical delivery to surface a problem that existed from the first afternoon.
This is the real anatomy of “almost right”: not a dramatic failure at any single point, but a value that passes every check because every check is designed to catch a different kind of problem than the one that actually exists.
5. Why the Engineer Who Made the Error Can’t Catch It
There’s a structural reason self-review fails for this error class, and it has nothing to do with individual competence.
The engineer who places 60 control points across 15 drawings in an afternoon is operating under cumulative fatigue by the time they reach drawing 12. When that same engineer reviews their own output minutes later, they are reviewing it under the same fatigue state that produced the error in the first place. The mental model that led them to write 100.5 instead of 105.0 is the same mental model checking whether 100.5 looks right — and it does, to that mental model, in that moment.
This is why “review your own work more carefully” is not an effective solution to this error class. It’s not a diligence problem. It’s a structural one: the error and the check for the error share the same source.
The same logic applies to label formatting inconsistency across a drawing package. Each individual engineer formats their own drawings according to their own understanding of the company standard — and checks their own drawings against that same understanding. Variance across the package is invisible to any single contributor, because no individual sees the aggregate.
6. What Changes When the Error Becomes Impossible
The alternative to “review more carefully” is not “review even more carefully still.” It’s removing the human judgment step from tasks where that judgment is the source of the risk — replacing it with rule-based execution that produces the same output every time, regardless of fatigue, time of day, or which engineer is running it.
This is the core mechanism behind shinsei-macro’s approach to the five error categories above:
| Error Category | Native Automation Fix | What Changes Structurally |
| Control point values | AddControlPointToSupport | CPs calculated from the support geometry and active piping specification — not typed by hand |
| Label and title placement | AlignLabel | Every label positioned per a single configuration file — no individual judgment involved |
| Isometric support attachment | InputSupportAttach | All support positions processed as a batch — a skipped item is no longer possible |
| Catalog component specification | Catalogue & Specification Macro | Cross-layer consistency enforced at data entry, before the record can be saved |
| Bulk pipeline attributes | SetPipeLineProperties | Changes applied to the full defined set via Excel, with the complete list visible for verification before execution |
The important distinction is not “faster” — though every one of these tools is also dramatically faster than the manual equivalent. The important distinction is that the output no longer depends on a human being alert, well-rested, and error-free on a specific Thursday afternoon. It depends on a configuration file and a piece of geometry that don’t get tired.
[Internal link: “The Forte 3D Time Audit Report — Where EPC Engineering Hours Go and How to Get Them Back”] Full benchmark data for every macro referenced above, including time and step reduction for each task.
7. The Project-Level Payoff: Fewer Rejections, Faster Issuance
The direct financial case for closing the “almost right” gap connects to two project metrics that every EPC Project Director tracks closely.
Rejection rate. Structured QA/QC review already helps here — firms with consistent QA/QC discipline keep rework meaningfully lower than firms without it. But eliminating the underlying error source, rather than relying entirely on catching it at review, compounds that benefit. A drawing package that is structurally consistent by construction generates fewer rejection cycles regardless of how thorough the review process is, because there’s simply less inconsistency for a reviewer to find.
Drawing issuance rate. Every rejection cycle — typically 1 to 3 days of revision and re-issuance — delays the procurement and fabrication activities that depend on that drawing. Because errors caught early are dramatically cheaper to fix than errors caught late, structurally preventing the error in the first place removes both the correction cost and the schedule delay in one action, rather than trading one for the other.
The combined effect is not just “fewer errors” in the abstract — it’s a drawing package that moves through the review-to-issuance pipeline faster, with fewer stalls, because the source of the stalls has been removed rather than merely detected sooner.
8. A Practical Self-Audit: Where Is Your Project Exposed?
Before assuming your team’s error profile matches the five categories above exactly, use this short audit to identify where your specific project carries the most “almost right” exposure.
Ask your team:
- Do control points get added to support drawings one at a time, by hand, in long working sessions? (Exposure: control point value errors)
- Do different engineers format labels and titles based on their own interpretation of the company standard, rather than a shared configuration file? (Exposure: label drift)
- Is isometric support attachment done pipeline-by-pipeline with no batch verification step? (Exposure: omitted support positions)
- Does your catalog setup process rely on manually cross-referencing multiple Excel workbooks with no automated consistency check? (Exposure: silent catalog errors)
- When pipeline attributes are updated in bulk, is the full list of affected pipelines reviewed in one place before the change is applied — or updated pipeline-by-pipeline? (Exposure: partial-batch updates)
Any “yes” to the risk-side of these questions identifies a specific, addressable point where your project is currently relying on individual attentiveness to catch an error class that individual attentiveness structurally cannot catch.
[Internal link: “Give Your Forte 3D Engineers Back Their Time”] (companion article on the productivity dimension of the same automation)
9. References and Further Reading
QA/QC and Rework Cost Data
- How to Run a Pre-QC Pass That Saves Architecture Time — Dan Cumberland Labs: Consolidates 2025 industry research on QA/QC discipline’s measurable impact on rework rates, including the 56%-vs-37% finding cited in this article.
- Cost of Rework in Construction: Causes, Data & Prevention (2025) — PlanRadar: The primary 2025 industry consolidation showing rework at 4–10% of project cost and design-error contribution declining to 1–2% with BIM maturity.
- Design Reviews — Project Delivery Manual, Chapter 9: QA/QC During Design — Bureau of Engineering, City of Los Angeles: Public-sector reference on structured design review practice.
- Quality Assurance and Quality Control in Structural Engineering — Wallace Design Collective: Practitioner perspective on QA vs. QC distinctions in engineering practice.
Material Take-Off and Downstream Data Integrity
- MTO (Material Take-Off) in EPC: How to Quantify from Isometrics — PathNovo: Documents how detailed-engineering MTO reaches 90–95% accuracy from approved isometrics — underscoring why isometric-stage errors propagate directly into procurement accuracy.
10. FAQ
Q1. Isn’t this just an argument for stricter QA/QC review?
No — and that distinction is the point of this article. Stricter review helps, and the data confirms it (56% vs. 37% rework outcomes based on QA/QC discipline). But review is a detection mechanism, and the error class described here is specifically the kind that resists detection because it looks correct in isolation. The more effective fix is removing the human judgment step that produces the error, not asking the same review process to try harder.
Q2. Does this mean engineers are making these mistakes because they’re careless?
No. The article’s central argument is the opposite: these errors are structural, not personal. An experienced, careful engineer working under normal conditions will still produce this error class at scale, because the task itself — repetitive manual entry across dozens of similar items — creates fatigue-driven variance that no amount of individual diligence eliminates. The fix is changing the task, not the person.
Q3. Which error category from this article is the most financially significant?
Catalog component specification errors typically carry the highest downstream cost, because they are the most invisible — a wrong material grade code can pass into the 3D model, the isometric BOM, and a purchase order without any visual signal that anything is wrong. Control point value errors are the second most costly category, because they directly determine fabrication dimensions and can result in a scrapped and re-fabricated support assembly.
Q4. How is this different from the QA/QC Prevention Report white paper?
This article makes the underlying case for why structural prevention matters — the “almost right” psychology and the self-review limitation. The QA/QC Prevention Report goes deeper into the mechanics of each of the seven error categories with full benchmark data, downstream cost analysis, and implementation sequencing. Read this article first for the conceptual framework; read the white paper for the complete technical reference.
Q5. Can better training solve this instead of automation?
Training helps engineers understand company standards and catch obviously wrong output — but it cannot solve a fatigue-driven, self-review-blind error class, because the error occurs precisely when the trained judgment is operating under the same conditions that produced the mistake. No amount of training changes the fact that the checker and the producer are the same tired person at the same moment. Removing the manual step is the only intervention that addresses the root cause rather than the symptom.
Shinsei Vietnam is a specialist Octave Forte 3D automation partner, part of Tatsusei Giken. Our 16-macro suite is built exclusively for Octave Forte 3D (formerly Hexagon Smart 3D) using native API integration. We serve EPC firms globally on oil and gas, petrochemical, LNG, and industrial plant projects.