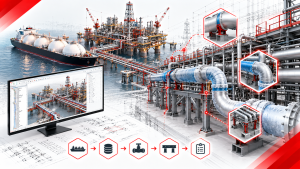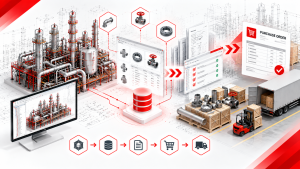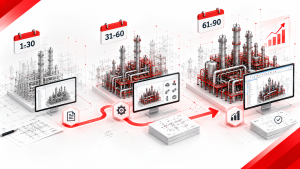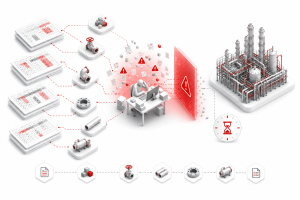


If you work in EPC project management or plant engineering, you already know that the project schedule rarely fails at the phase everyone is watching. It fails in the transition from detailed engineering to construction — where design errors that were invisible on screen become physical obstructions on site, and where the cost of fixing them multiplies by 10 to 50 times compared to catching them at the drawing stage.
In this guide, Shinsei Vietnam’s engineering team maps the complete plant design workflow phase by phase — from conceptual design through FEED, detailed engineering, procurement, construction, and commissioning — and identifies exactly where the workflow breaks down, what it costs, and how native 3D automation addresses the bottleneck at its source.
1. What Is Plant Design? | Definition, Scope, and Project Types

Plant design is the engineering discipline responsible for designing large-scale industrial production and processing facilities — from oil refineries and petrochemical complexes to power generation plants, water treatment facilities, and pharmaceutical manufacturing sites.
Unlike general mechanical or civil engineering, plant design is a systems integration discipline. The deliverable is not a single machine or structure — it is a complete, interconnected facility where piping, equipment, structural steel, electrical systems, instrumentation, and civil foundations must all coexist, function safely together, and be constructible and maintainable for a decades-long operational life.
Plant Types and Primary Clients
| Plant Type | Primary Purpose | Typical Client |
| Petrochemical / Refinery | Oil refining, chemical production | Oil majors, integrated chemical companies |
| LNG (Liquefied Natural Gas) | Gas liquefaction, storage, export | National oil companies, energy majors |
| Power Generation | Thermal, nuclear, renewable energy | Power utilities, IPPs (Independent Power Producers) |
| Water Treatment | Drinking water, wastewater, industrial effluent | Municipalities, industrial manufacturers |
| Waste-to-Energy / Incineration | Waste processing, energy recovery | Municipalities, waste management firms |
| Food and Pharmaceutical | Food processing, drug manufacturing | FMCG companies, pharmaceutical groups |
| Steel and Metals | Primary metal production, smelting | Integrated steelmakers |
What Makes Plant Design Different from Other Engineering
Three characteristics set plant design apart from other engineering disciplines:
1. Scale and Complexity A single mid-sized petrochemical plant contains thousands of piping components, hundreds of pieces of equipment, miles of cable, and thousands of structural steel members — all of which must fit within a defined plot plan without clashing with each other or violating operational and maintenance access requirements.
2. Multi-Discipline Integration No single engineer or discipline designs a plant. Process, piping, mechanical, structural, electrical, instrumentation, civil, and safety engineering teams all contribute simultaneously, with every discipline’s decisions affecting all others. A 300mm shift in equipment location by a mechanical engineer can cascade into piping reroutes, structural modifications, and cable tray changes across multiple drawings.
3. Downstream Cost Amplification Design decisions made early in the project carry a disproportionate cost impact. An error in FEED that is caught during detailed engineering costs far less to fix than the same error discovered during construction — where correction requires stopping physical work, demobilizing crews, and re-fabricating installed components. Industry data consistently shows construction-phase correction costs running 5 to 20% of total project value for projects that experience significant rework. (Source: ScienceDirect — Subcontracting and rework cost sharing in EPC projects)
2. The Plant Design Workflow | 6 Phases Overview

The plant design workflow follows a structured, phase-gated process. Each phase builds on the previous one, with design completeness increasing progressively from a broad concept (~10–15% engineering complete at conceptual stage) to fully issued construction drawings (100% engineering complete at IFC stage).
| Phase | Engineering Completion | Primary Purpose | Key Deliverables | Typical Duration |
| ① Conceptual Design | ~10–15% | Define plant scope, capacity, site layout | PFD, plot plan, concept cost estimate, feasibility study | 1–3 months |
| ② FEED | ~25–40% | Develop engineering basis for EPC bid | P&ID, equipment datasheets, piping classes, cost estimate (±15–20%) | 3–9 months |
| ③ Detailed Engineering | 100% | Produce all construction-ready deliverables | 3D model, piping isometrics, equipment specs, structural drawings, electrical SLDs | 6 months–2+ years |
| ④ Procurement | — | Source and purchase all materials and equipment | Purchase orders, vendor documentation, expediting records | Overlaps with Phase 3 |
| ⑤ Construction | — | Physically build the plant | Fabricated spools, installed equipment, civil works, electrical systems | 1–3 years |
| ⑥ Commissioning & Handover | — | Verify plant performance, hand over to owner | Commissioning records, as-built drawings, performance test certificates | 2–6 months |
Note: Durations represent general guidance for mid-sized onshore projects. Large LNG terminals, refineries, and nuclear plants regularly extend beyond these ranges at every phase. Procurement typically begins during detailed engineering for long-lead equipment items.
The critical insight: Design quality in Phases 1–3 determines cost and schedule performance in Phases 4–6. Rework costs are not linear — they escalate dramatically the later an error is detected in the workflow. A design clash caught in the 3D model review costs minutes to fix. The same clash discovered when a prefabricated spool arrives on site and fails fit-up can cost days of schedule and tens of thousands of dollars in re-fabrication.
3. Phase 1: Conceptual Design | Defining What Gets Built
Conceptual design is where the project is first given physical form. The client’s production requirements — process capacity, product specifications, site constraints, budget target — are translated into a preliminary plant configuration.
What Happens in Conceptual Design
- Process Flow Diagram (PFD) development: The process engineer maps the major equipment items (reactors, distillation columns, heat exchangers, storage tanks) and the flow of materials between them. This is the first engineering document that shows what the plant actually does.
- Preliminary plot plan: The plant layout team defines the site boundary and positions the major equipment areas, utility systems, control room, and flare stack in relation to each other — accounting for safety distances, prevailing wind direction, and maintenance access.
- Equipment list development: A preliminary list of major equipment items with approximate sizes, materials, and duty conditions is established.
- Conceptual cost estimate: A Class 5 estimate (accuracy typically ±50%) based on factored equipment costs or capacity-based algorithms. Used for project go/no-go decisions.
- Feasibility study inputs: Data to support the owner’s investment decision and regulatory permitting.
Key Deliverables
| Deliverable | Purpose |
| PFD (Process Flow Diagram) | Shows process flow, major equipment, key stream data |
| Preliminary plot plan | Defines site layout and area allocation |
| Equipment list (preliminary) | Major equipment items with approximate duty |
| Conceptual cost estimate | Investment decision support (±50% accuracy) |
| Feasibility study | Technical and commercial viability assessment |
Why Conceptual Design Quality Matters
Decisions made in conceptual design are the hardest and most expensive to reverse. Plot plan orientation, major equipment positioning, and process route selection all become embedded assumptions that flow through every subsequent phase. A process route chosen in conceptual design that later proves sub-optimal may require fundamental P&ID changes in FEED — at 10× the cost of having explored alternatives earlier.
4. Phase 2: FEED | Front-End Engineering Design
FEED (Front-End Engineering Design) is the engineering phase that bridges conceptual design and the EPC contract. It is where the engineering basis is established in sufficient detail to allow EPC contractors to bid a fixed-price contract — and where the owner locks in the technical scope that all subsequent detailed engineering must follow.
What Happens in FEED
FEED typically represents 25–40% of total engineering and produces the technical package that forms the contractual basis for the EPC bid:
- P&ID (Piping and Instrumentation Diagram) development: The P&ID details every pipe, valve, instrument, and control loop — the definitive schematic of the plant’s piping and control architecture. Changes to the P&ID during detailed engineering can cascade into major scope changes.
- Equipment datasheets: Detailed technical specifications for every major equipment item, used for vendor enquiries and procurement.
- Piping material classes: The specification system that governs which pipe, fittings, flanges, and valves are permissible for each combination of fluid service, pressure class, and temperature range. This is the document that the 3D model and isometric drawings must comply with.
- Hazard studies (HAZOP, SIL): Structured risk reviews that challenge the P&ID design and may generate significant changes before detailed engineering begins.
- Cost estimate (Class 3): ±15–20% accuracy estimate based on defined equipment costs and vendor quotes for major items.
Key Deliverables
| Deliverable | Description |
| P&ID (Piping & Instrumentation Diagram) | Definitive schematic of all piping and control systems |
| Equipment datasheets | Technical specs for procurement of major items |
| Piping material classes (pipe specs) | Specification governing material selection by service |
| Plot plan (developed) | Confirmed equipment layout and infrastructure |
| FEED cost estimate | ±15–20% accuracy for EPC bidding |
| HAZOP / SIL study reports | Safety-driven design changes incorporated |
| FEED package | Complete bid basis for EPC contract |
Key risk at FEED: An incomplete or inconsistent FEED package is the primary source of EPC contractor claims and change orders. When P&IDs issued at FEED contain assumptions that turn out to be incorrect, or when piping material classes are not fully defined, EPC contractors discover the gaps during detailed engineering — and the cost of resolving them in a fixed-price contract becomes a source of commercial dispute. Well-executed FEED is the single most effective investment in EPC project cost control.
[Internal link: “P&ID vs PFD: Key Differences and How Each Drives Downstream Plant Design Decisions”]
5. Phase 3: Detailed Engineering | The 3D Model, Piping, and Deliverables
Detailed engineering is the most labor-intensive phase of the plant design workflow. Starting from the FEED package (typically 25–40% engineering complete), the detailed engineering team must develop every system to 100% construction-ready status across all disciplines simultaneously.
The Detailed Engineering Workflow: Step by Step
| Step | Activity | Output |
| 1 | P&ID finalization and sign-off | Issued-for-design P&IDs |
| 2 | Equipment vendor drawing receipt and review | Certified vendor drawings incorporated into design |
| 3 | 3D model build — all disciplines | Coordinated 3D model in Forte 3D (formerly Smart 3D) / AVEVA E3D |
| 4 | Clash detection reviews (interdiscipline) | RFIs resolved; model updated |
| 5 | Piping stress analysis | CAESAR II or equivalent; support locations confirmed |
| 6 | Isometric extraction from 3D model | Raw isometrics generated via PCF/Isogen |
| 7 | Isometric detailing and annotation | Support attachment, control points, label alignment (see Section 10) |
| 8 | Model review and QA/QC | IFR (Issued for Review) drawings reviewed |
| 9 | Drawing revision and approval | Comments incorporated |
| 10 | IFC issuance | Issued for Construction drawings released to procurement and site |
Scale of the Detailed Engineering Challenge
To understand why detailed engineering is where project schedules most often slip, consider the scope:
| Parameter | Mid-Sized Plant | Large Plant |
| Piping components | Thousands | Tens of thousands |
| Isometric drawings | Hundreds | Thousands |
| Equipment items | Hundreds | Thousands |
| Pipe support drawings | Hundreds | Thousands |
| Engineering disciplines | 6–8 | 8+ |
| Peak engineering headcount | 50–200 | 200–1,000+ |
Every one of these deliverables must be produced, reviewed, revised, and issued — with all disciplines staying coordinated throughout. The 3D model is the coordination hub: it is where clashes are caught and where every discipline’s work must spatially coexist.
Why Phase 3 Is Where the Schedule Is Won or Lost
The detailed design stage follows after FEED, refining the basic design from typically 12 to 20% engineering completion to 100% — an iterative process, as different design activities can influence each other. For example, equipment design by vendors or routing of pipes may cause changes to the plant layout design.
This iterative nature means that detailed engineering is inherently non-linear. A vendor drawing received late forces rerouting of adjacent pipes. A pipe stress analysis result requires a support to be repositioned. A structural steel connection detail changes clearances for a cable tray. Every change propagates through the model and through the drawing set.
The teams that control this iteration cycle — that maintain model-to-drawing consistency and produce clash-free isometrics efficiently — deliver projects. The teams that fall behind in drawing production find themselves issuing unchecked drawings to meet schedule pressure, which becomes the source of construction rework.
[Internal link: “How Forte 3D’s Spec-Driven Architecture Reduces Rework in Detailed Engineering”]
6. Phase 4: Procurement | Where Design Errors Become Cost Overruns
Procurement overlaps with detailed engineering — long-lead equipment items (reactors, compressors, heat exchangers, large valves) must be ordered early because their delivery timelines of 12–36 months can define the construction start date.
How Design Feeds Procurement
| Design Document | Procurement Function |
| Equipment datasheets | Basis for purchase requisition and vendor RFQ |
| Piping material class | Defines allowable materials for piping BOM |
| Isometric BOM (Bill of Materials) | Drives bulk material quantity requirements |
| Vendor certified drawings | Incorporated into 3D model; any dimension change = design revision |
| Pipe support drawings | Drives structural steel quantities for support fabrication |
Where Design Errors Become Procurement Disasters
The BOM (Bill of Materials) extracted from each piping isometric drives bulk material orders for pipe, fittings, flanges, and valves. If an isometric contains an error — a wrong pipe class, an incorrect elbow count, a missing flange — the BOM is wrong. The wrong BOM generates a wrong purchase order. The wrong purchase order delivers wrong materials to site.
At this point, the design error has become a construction delay:
- Site team discovers incorrect material at installation
- RFI raised to design team
- Design revision issued
- Correct material re-ordered or re-sourced
- Fabricated spool that used wrong material must be scrapped and re-fabricated
The cost of this sequence — in man-hours, material waste, and schedule delay — is why industry estimations of rework costs as a proportion of total project cost range from 5% to more than 20%. And the further into construction the error is discovered, the more expensive it becomes to resolve.
7. Phase 5: Construction and Commissioning | Where Everything Converges
Construction is where the plant design workflow produces its physical output. Every decision made across Phases 1–4 converges on site — and every error that survived through the drawing review process becomes a tangible, expensive problem.
Construction Sequence for a Typical Plant
| Construction Activity | Depends On |
| Civil foundations | Equipment layout drawings, equipment weights from vendor |
| Structural steel erection | Structural drawings, equipment datasheets |
| Equipment installation | Certified vendor drawings, foundations complete |
| Pipe spool fabrication | Piping isometrics issued for construction |
| Pipe spool installation | Spools fabricated, equipment installed, supports in place |
| Electrical cable installation | Cable routing drawings, equipment terminal data |
| Instrumentation installation | Instrument datasheets, hook-up drawings |
| Hydrostatic testing | Piping isometrics with test limits marked |
| Commissioning | P&IDs, operating procedures, PLC logic |
The Spool Fabrication Dependency
Pipe spools are prefabricated in a workshop — not on site. The spool shop builds from the piping isometric, cutting pipe to length, adding fittings, and welding the assembly according to the drawing. The completed spool is then transported to site for installation.
This means that isometric quality is not a documentation issue — it is a fabrication quality control issue. An error in an isometric that reaches the spool shop results in a fabricated spool that does not fit its intended location. The spool must be rejected, scrapped, and re-fabricated — with all associated delays cascading into the construction schedule.
A single missed support position or incorrect dimension on a support drawing can delay the entire spool installation sequence for that pipeline — holding up the cascade of activities (hydrostatic testing, insulation, electrical hook-up, commissioning) that depend on it.
Commissioning
Once construction is substantially complete, the commissioning phase verifies that the plant operates as designed. Loop checks, functional tests, pre-commissioning flushing, and performance testing are all conducted against the engineering documentation. Any discrepancy between the physical plant and the design documentation generates an as-built revision — a drawing correction that should have been made during detailed engineering but was not.
The volume of as-built corrections required at commissioning is a direct measure of the quality of the detailed engineering and drawing control that preceded it.
8. The 8 Engineering Disciplines in Plant Design | Who Does What
Plant design requires coordinated input from multiple engineering disciplines. Understanding who is responsible for what — and how their work intersects — is essential for anyone managing a plant design workflow.
| Discipline | Primary Responsibility | Primary Tools | 3D Model Contribution |
| Process Engineering | PFD, P&ID, process simulation, heat and material balance | Aspen HYSYS, PRO/II | Equipment sizing, stream data |
| Piping Engineering | Pipe routing, material class compliance, support design, isometric production | Forte 3D, AVEVA E3D | Piping model (largest 3D contribution) |
| Mechanical Engineering | Equipment design (vessels, heat exchangers, pumps, compressors) | PV Elite, Compress | Equipment model |
| Structural Engineering | Pipe racks, equipment foundations, structural steel, seismic design | STAAD.Pro, TEKLA | Structural model |
| Electrical Engineering | HV/LV systems, motor control, lighting, earthing, cable routing | ETAP, EPLAN | Cable tray and equipment model |
| Instrumentation & Control | Instrumentation selection, hook-up, control philosophy, DCS/SIS | INTOOLS, AVEVA Engineering | Instrument model |
| Civil Engineering | Site grading, underground drainage, road layout, foundations | Civil 3D | Civil model |
| Safety / Environmental | HAZOP, SIL assessment, safety case, environmental permitting | PHAWorks, SILver | Review input only |
Note: Discipline boundaries vary between organizations. Some firms combine mechanical and piping; others separate instrumentation from electrical. The coordination interfaces between disciplines — not the internal structure of any one team — are what drive project complexity.
Why Piping Is the Central Discipline
Of the eight disciplines, piping is the one that physically connects all others. Every equipment nozzle must have a connected pipe. Every valve and instrument must be in the pipe routing. Every structural member must be checked for clearance with every pipe. Every cable tray must navigate around every pipe run.
This connectivity means that piping design cannot be finalized until all other disciplines have reached sufficient design maturity — and any change in any other discipline potentially requires a piping revision. This is the structural reason why piping design consumes a disproportionate share of detailed engineering time.
9. Why Piping Design Consumes 30–50% of Detailed Engineering | A Workflow Analysis

Based on Shinsei Vietnam’s experience supporting multiple EPC plant design projects and corroborated by industry data, piping design and the associated drawing production activities consistently account for 30–50% of total detailed engineering man-hours. On large, high-pressure, or heavily regulated plants, this proportion can be higher.
Three structural factors explain this consistently:
Factor 1: Volume and Interdependency
Piping design in particular, which takes roughly 30% of the engineering phase, must conform to a variety of challenging limitations to standardize the design — such as process requirements, costliness, usability, workability, and responses to changes in the upstream phase.
A mid-sized plant may contain thousands of individual pipe segments, each carrying multiple parameters: size, schedule, material class, routing path, support positions, stress analysis inputs, and insulation specification. Change one parameter on one pipe and the ripple effects may require updates to adjacent piping, support drawings, the isometric BOM, and the material requisition.
Factor 2: High-Pressure and Regulated Plants Amplify Per-Pipe Work
For oil and gas, LNG, and chemical plants handling hazardous or high-pressure streams, each pipe requires additional engineering work that smaller industrial projects do not:
- Pressure class verification against pipe specification
- Thermal expansion and flexibility analysis (CAESAR II or equivalent)
- Seismic support strength calculations
- Regulatory inspection requirements (pressure testing, weld inspection)
- Documentation for insurance and permitting
This additional per-pipe workload scales the absolute volume of piping engineering work non-linearly with project complexity.
Factor 3: Post-Extraction Isometric Detailing Is Entirely Manual
Even after the 3D model is complete and raw isometrics are extracted, significant manual work remains before a drawing can be issued. In a standard Forte 3D or AVEVA E3D environment, this includes:
- Attaching each pipe support position to the isometric (one at a time)
- Adding control point annotations for each support drawing
- Aligning labels and titles to company drawing standards
- Setting drawing scales for each support drawing
This post-extraction manual workload is where the piping design bottleneck is most acute — and most often underestimated in project scheduling.
The Leverage Effect: Why Piping Efficiency Matters for Total Project Cost
| Efficiency Gain in Piping Detailing | If Piping = 30% of Project | If Piping = 50% of Project |
| 20% reduction | ~6% total project man-hour reduction | ~10% total project man-hour reduction |
| 50% reduction | ~15% total project man-hour reduction | ~25% total project man-hour reduction |
| 91.8% reduction (Shinsei 4-macro combined) | ~28% total project man-hour reduction | ~46% total project man-hour reduction |
Note: Illustrative leverage calculations. Actual savings depend on project scope, drawing volume, and conditions.
On a project with 100,000 total engineering hours, a 6–10% reduction from piping detailing efficiency translates to 6,000–10,000 recovered hours — equivalent to staffing several additional engineers through the peak delivery phase, or compressing the schedule by weeks.
10. The Efficiency Gap Inside Phase 3 | Where Plant Design Workflows Actually Break Down

The plant design workflow does not typically fail at the phase level — it fails at the sub-task level within detailed engineering. Specifically, it fails in the four manual stages between isometric extraction and drawing issuance.
The Four Manual Bottlenecks in Forte 3D (Smart 3D) Isometric Workflows
| Stage | What Happens Manually | Benchmark Time (Shinsei internal measurement) |
| Support attachment | Each pipe support position manually attached to isometric, one at a time, across individual pipelines — no batch processing | 12 min / 30 steps per 6 positions |
| Control point annotation | Each control point (Elevation, Dimension, Origin) manually added to each support drawing, one drawing at a time | 24 min / 60 steps per 12 CPs |
| Label alignment | Labels, titles, and table positions manually adjusted to company drawing standards, by each individual drafter | 3 min / 6 steps per drawing |
| Drawing scale setting | Scale factor manually selected and verified for each support drawing | 5 min / 7 steps per drawing |
| Total per drawing package | — | 44 min / 103 steps |
On a 2,000-drawing project, this compounds to approximately 1,467 hours of manual annotation and formatting work — entirely separate from the engineering judgment that produced the 3D model. This is the hidden efficiency gap that plant design workflows universally carry, and that no 3D platform currently addresses in its default configuration.
Why This Gap Persists
The gap persists for two reasons:
1. It is invisible in project planning. Schedule templates allocate time for “detailed engineering” as a block. The sub-tasks within isometric production — support attachment, control point detailing, label alignment — are rarely broken out separately, which means the manual effort is underestimated and the workforce is over-allocated to model-building while drawing issuance falls behind.
2. Generic tools do not work at scale. BIM Managers who recognize the bottleneck often evaluate generic CAD automation scripts or third-party plugins. These consistently fail in Forte 3D’s SQL/Oracle environment due to PCF/IFC export-import metadata loss, memory crashes when processing large batches, and inability to read active piping specifications.
11. How Native 3D Automation Fixes the Detailed Engineering Bottleneck

The solution to the post-extraction bottleneck is not a faster generic tool — it is automation built natively inside the 3D platform, operating directly on the live project database with no data translation.
Shinsei Vietnam’s macro suite is built exclusively for Octave Forte 3D using native .NET API integration. There is no PCF export. No IFC roundtrip. Every macro runs inside the Forte 3D user interface, acting on the live database with full access to active piping specifications and drawing standards.
Benchmark: Manual vs. Automated Post-Extraction Workflow
All figures from Shinsei Vietnam internal time-and-motion measurements on real Forte 3D project environments.
| Stage | Macro | Manual | Automated | Gain |
| Support attachment (6 positions) | InputSupportAttach | 12.0 min / 30 steps | 0.5 min / 3 steps | 95.8% faster |
| Control point detailing (12 CPs) | AddControlPointToSupport | 24.0 min / 60 steps | 1.0 min / 3 steps | 95.8% faster |
| Label alignment (1 drawing) | AlignLabel | 3.0 min / 6 steps | 0.1 min / 2 steps | 96.6% faster |
| Drawing scale (1 drawing) | DwgSupportScale | 5.0 min / 7 steps | 2.0 min / 9 steps | 60.0% faster |
| Combined (all 4) | — | 44.0 min / 103 steps | 3.6 min / 17 steps | 91.8% net |
What This Means for the Plant Design Workflow
Reducing the post-extraction detailing burden from 44 minutes to 3.6 minutes per drawing package has three compounding effects on the plant design workflow:
1. Drawing issuance accelerates. Procurement teams receive correct, fully-detailed isometrics faster — enabling earlier material requisitions and reducing the risk of long-lead material delays.
2. QA/QC consistency improves. Automated label alignment and control point placement follow predefined configuration rules — eliminating engineer-to-engineer variability that creates drawing package inconsistency.
3. Senior engineers are freed for high-value work. Hours previously consumed by annotation and formatting are redirected to clash resolution, constructability review, and stress analysis — the engineering judgment that actually protects project quality.
Illustrative Project-Scale Impact
Assumptions: 2,000 support drawings/isometrics, $80 USD/hour loaded engineering rate. Actual results vary by project scope and conditions.
| Scenario | Hours | Cost |
| Manual workflow | ~1,467 hrs | ~$117,360 |
| Shinsei automated | ~120 hrs | ~$9,600 |
| Recovered | ~1,347 hrs | ~$107,760 (~92% reduction) |
[Internal link: “Download Free — The Forte 3D ROI Report: Quantifying Automation Value Across the Plant Design Workflow”]
12. Plant Design Software by Phase | Which Tools Are Used When
Plant design is multi-tool by nature. Different software is dominant at each phase of the workflow. Understanding this landscape helps BIM Managers and IT leads plan their software ecosystem and integration requirements.
| Phase | Discipline | Primary Software | Purpose |
| Conceptual / FEED | Process | Aspen HYSYS, PRO/II, UNISIM | Process simulation, heat and material balance |
| FEED | All | SmartPlant Foundation, AVEVA Engineering | Engineering data management, P&ID development |
| FEED / Detailed | P&ID | SmartPlant P&ID, AVEVA Diagrams | Intelligent P&ID creation and management |
| Detailed Engineering | Piping / All | Octave Forte 3D, AVEVA E3D | 3D plant modeling, clash detection, isometric extraction |
| Detailed Engineering | Piping Stress | CAESAR II | Pipe flexibility and stress analysis |
| Detailed Engineering | Structural | STAAD.Pro, TEKLA Structures | Structural analysis and detailing |
| Detailed Engineering | Electrical | ETAP, EPLAN | Electrical system design and analysis |
| Detailed Engineering | Instrumentation | AVEVA Engineering (INTOOLS) | Instrument database, hook-up drawings |
| Isometric Production | Piping | Isogen® (via PCF), Isodraft (AVEVA) | Isometric drawing generation from 3D model |
| Post-Extraction | Piping | Shinsei Vietnam Macros (Forte 3D) | Native automation: support attachment, CP detailing, formatting |
| Project Control | All | Primavera P6, MS Project | Schedule management, resource planning |
| Document Control | All | Aconex, Documentum, SharePoint | Drawing issuance, revision control, transmittals |
| Clash Review | All | Navisworks, SmartPlant Review | Multi-discipline visual clash review |
| Construction | All | Navisworks, Bentley Synchro | 4D construction simulation, site management |
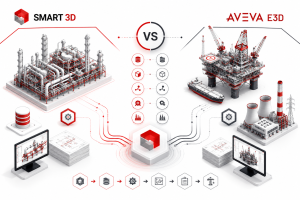
[Internal link: “Forte 3D vs AVEVA E3D — Which 3D Plant Design Platform Is Right for Your EPC Project?”]
13. References and Further Reading
Plant Design Workflow and EPC Engineering
- Design Stages in EPC Projects: From Concept to Construction — Method Statement Central: Comprehensive breakdown of all EPC design stages, deliverables, and design management principles (January 2026).
- Detailed Design: Completing the Engineering Puzzle — Assai Software: Authoritative guide to the detailed design phase, including the iterative nature of design and vendor drawing integration.
- 12 Phases of Project Life Cycle — What Is Piping: Complete oil and gas project lifecycle from pre-FEED through commissioning and handover.
- EPC Projects: The Role of Plant Design Engineers — Taal Tech: Practical breakdown of plant design engineer responsibilities across EPC phases.
- Evaluation of Changes in Process Plant Projects — Long International: Technical analysis of design change cost impacts and EPC contractor change order claims.
- Subcontracting and Rework Cost Sharing in EPC Projects — ScienceDirect: Peer-reviewed analysis of rework costs in EPC projects (5–20% of total project cost).
3D Plant Design Software
- Forte 3D (SP3D) Plant Design — Projectmaterials.com: Comprehensive technical reference on Forte 3D architecture and workflow.
- AVEVA E3D Design for Plant and Piping — Projectmaterials.com: Authoritative breakdown of AVEVA E3D architecture, PDMS legacy, and market adoption.
- How to Plan Piping Isometric Production — PipingStress.net: Practical guidance on isometric production planning and the causes of isometric bottlenecks in EPC projects.
Shinsei Vietnam Resources
- [Download Free: Eliminating Manual Bottlenecks in EPC Plant Design — The 2026 Guide to Forte 3D Automation]
- [Download Free: Manual Drafting vs. Native Automation — The Ultimate Guide to Automated Isometrics in Forte 3D]
- [Download: Shinsei Vietnam 16-Macro Solution Catalog] — Full capability overview of all 16 native Forte 3D macros
- [Book a Live Technical Demo] — See Shinsei macros run on your Forte 3D project data
14. FAQ
Q1. What is the difference between plant design and plant engineering?
Plant design refers specifically to the engineering design activities — producing 3D models, drawings, specifications, and technical documents that define what gets built and how. Plant engineering (or plant engineering as a broader concept) encompasses design plus the procurement, construction management, commissioning, and operations support functions. In an EPC (Engineering, Procurement, and Construction) context, both terms are often used interchangeably, but “plant design” more precisely refers to the engineering and documentation output, while “plant engineering” describes the full integrated service.
Q2. What is FEED and why does it matter so much for EPC projects?
FEED (Front-End Engineering Design) is the engineering phase conducted before the EPC contract is placed. It develops the project from a conceptual idea (~10–15% engineering complete) to a defined technical basis (25–40% engineering complete) that is sufficiently detailed to allow EPC contractors to prepare a fixed-price bid. FEED quality matters enormously because it defines the engineering scope that all subsequent detailed engineering must follow. An incomplete FEED package — with undefined pipe classes, missing equipment datasheets, or unresolved P&ID issues — results in scope growth during detailed engineering, which in a fixed-price EPC contract becomes a source of contractor claims, commercial disputes, and schedule delays.
Q3. Why does piping design take so much longer than other disciplines in detailed engineering?
Three factors: volume (a mid-sized plant has thousands of individual pipe segments, each requiring individual routing, specification compliance, support design, and documentation), mutual dependency (piping connects every other discipline, so any change in equipment, structure, or instrumentation requires a piping revision), and the post-extraction documentation burden (after the 3D model is complete, raw isometrics still require significant manual annotation and formatting before they can be issued). The first two factors are inherent to plant design. The third — the post-extraction bottleneck — is addressable with native automation.
Q4. What is an IFC drawing, and why does it matter?
IFC stands for “Issued for Construction” — the final, approved status of an engineering drawing that authorizes the construction team to physically build from it. Before reaching IFC status, drawings go through multiple review states: IFD (Issued for Design), IFR (Issued for Review), IFA (Issued for Approval), AFC (Approved for Construction — sometimes used interchangeably with IFC). Each review cycle requires comment resolution and drawing revision. The rate at which drawings achieve IFC status is one of the key schedule control metrics in plant design project management.
Q5. What is the biggest risk in the plant design workflow?
Design errors that survive through the review process and reach construction. The earlier in the workflow an error is caught, the cheaper it is to fix. An error caught during 3D model review costs minutes. The same error caught during procurement means a wrong purchase order. Caught during fabrication, it means a scrapped spool. Caught on site during installation, it can cost days of schedule and tens of thousands of dollars. The plant design workflow’s quality control systems — clash detection reviews, 3D model reviews, IFR/IFC drawing reviews — exist specifically to prevent errors from compounding downstream. Industry data shows rework costs range from 5% to over 20% of total project value on projects that experience significant quality issues.
Q6. How does 3D modeling reduce rework compared to 2D design?
2D design (AutoCAD drawings only) has no automated clash detection. Pipe routes that conflict with structural steel, cable trays, or equipment are only discovered when someone manually checks the drawings — or when the conflict becomes physical during construction. 3D modeling in Forte 3D or AVEVA E3D maintains all disciplines in a shared 3D database, allowing automated clash detection to identify interferences before they reach the drawing stage. A pipe that runs through a structural beam in the 3D model generates a clash report in seconds. The same conflict in a 2D design may not be discovered until the prefabricated spool arrives on site and fails fit-up. The reduction in physical rework cost is the fundamental business case for enterprise 3D plant design software.
Q7. What is the relationship between piping isometrics and spool fabrication?
Piping isometrics are the construction documents from which pipe spools are fabricated. A pipe spool is a prefabricated pipe assembly — a section of pipeline with its fittings welded in a workshop, ready for field installation. The spool shop fabricates from the isometric: cutting pipe to the dimensions shown, adding elbows, tees, flanges, and instrument connections at the positions indicated, and welding to the weld numbers shown. If the isometric contains a dimensional error, the fabricated spool will not fit its intended installation location. Because fabrication typically happens weeks before on-site installation, errors may not be discovered until the spool arrives at site — at which point re-fabrication, material re-procurement, and schedule delay are all inevitable.
Q8. Can native automation tools in Forte 3D speed up the overall plant design workflow, or only specific tasks?
Native automation directly addresses the post-extraction isometric detailing workflow — specifically the four manual stages of support attachment, control point annotation, label alignment, and drawing scale configuration. In Shinsei Vietnam’s internal benchmarks, these four stages consume 44 minutes per drawing package manually and are reduced to 3.6 minutes with native automation (91.8% net reduction). The impact on the overall plant design workflow is proportional to drawing volume: on a 2,000-drawing project, this represents approximately 1,347 recovered engineering hours. Those hours are not saved by skipping work — the work is completed, to higher consistency, in less time. The recovered capacity can be redirected to clash resolution, constructability review, stress analysis coordination, and client communication: the high-value activities that directly protect project quality and schedule.
Shinsei Vietnam is a specialist Forte 3D automation partner, part of Tatsusei Giken. Our 16-macro suite is built exclusively for Octave Forte 3D using native API integration. We serve EPC firms globally on oil and gas, petrochemical, LNG, and industrial plant projects.