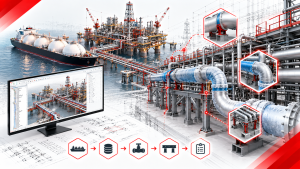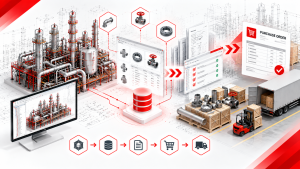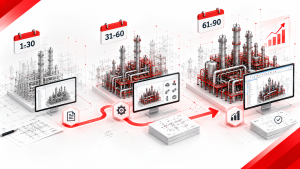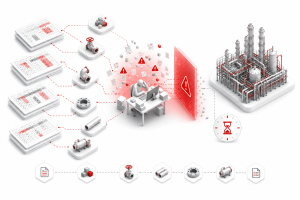


Do you find it difficult to grasp the full picture of EPC plant design workflows? The scope is wide, the disciplines are many, and the downstream documentation phase — where isometric drawings and support drawings are produced — is consistently the most underestimated bottleneck in the entire project cycle.
In this article, Shinsei Vietnam’s engineering team draws on firsthand experience supporting EPC plant design projects to explain: what piping isometrics are, how Octave Forte 3D (formerly Intergraph Smart 3D) generates them, where the manual workflow breaks down, and why native automation is the only architecture that solves the problem at project scale.
1. What Is a Piping Isometric Drawing?

A piping isometric drawing — universally referred to in the industry as an “iso” — is a three-dimensional representation of a pipeline rendered on a two-dimensional sheet. It uses isometric projection, where the three spatial axes (north–south, east–west, and vertical) appear at 120-degree angles to each other. The result is the distinctive angled-line layout that every piping engineer recognizes immediately.
Unlike P&IDs (which show process logic) or orthographic drawings (which show plan and elevation views), an isometric drawing is a direct construction document. A pipe fabricator in a workshop and a pipefitter on a construction site both read the same iso to understand exactly what needs to be built, where each component goes, and what the weld sequence is.
Every isometric drawing captures:
| Element | Description |
| Pipe routing and orientation | Every direction change, offset, and elevation transition |
| All piping components | Elbows, tees, reducers, flanges, valves, gaskets, bolts |
| Dimensional callouts | Face-to-face distances at every change of direction |
| Weld locations and types | Shop welds vs. field welds, weld numbers, weld sequence |
| Bill of Materials (BOM) | Complete component list for material procurement |
| Pipe support locations | Support type, position, and attachment detail |
| Design data | Line number, pipe class, design pressure, temperature, insulation code |
Isometrics are deliberately not drawn to scale. A 40-meter straight run and a 2-meter offset may appear the same line length on paper — what matters is the dimensional annotation, not the line length. This makes them universally readable without CAD software, which is exactly why they remain the primary construction document on every EPC project in the world.
Key distinction: P&IDs tell you what the process does. Isometrics tell the fabricator how to build it. Errors in one become physical problems in the other.
2. Why Piping Isometrics Are the Most Critical EPC Deliverable
In the EPC delivery chain, isometric drawings sit at the intersection of three critical project functions simultaneously.
| Function | Role of Isometrics | Consequence of Errors |
| Procurement | BOM extracted from each iso drives material requisitions | Wrong component count or missing specification → incorrect purchase order → material shortage → fabrication delay |
| Fabrication | Pipe spool shops build directly from isometrics | Incorrect elevation callout on support drawing → spool fails fit-up on site → re-fabrication cycle → schedule and cost overrun |
| Construction | Field pipefitters use isometrics as primary work instruction | Misaligned label, missing control point, incorrect support spec → confusion on site → installation delay → safety non-conformance |
This means isometric quality is not a documentation concern — it is a project delivery risk. Every error that survives into the issued drawing package carries a correction cost that is, by industry convention, 10 to 50 times higher at the construction phase than at the design phase.
On a typical mid-sized petrochemical plant, a project team may need to produce, review, and issue thousands of isometrics across dozens of line specifications. Getting this right — consistently and at speed — is one of the defining execution challenges of EPC detailed engineering.
3. EPC Plant Design Workflow | The Four Phases and Where Isometrics Fit
EPC plant design follows four structured phases. Understanding where isometric drawing production sits in this flow is essential to understanding why it becomes a bottleneck.
| Phase | Primary Purpose | Key Deliverables | Typical Duration |
| ① Basic / Conceptual Design | Define overall plant configuration and specifications | PFD (Process Flow Diagram), basic layout drawings, preliminary cost estimate | Several months to 6 months |
| ② Detailed Engineering | Finalize all equipment, piping, electrical, and instrumentation layout | P&ID, 3D model, piping isometrics, equipment datasheets, structural drawings | 6 months to 1+ year |
| ③ Procurement & Construction | Procure equipment and physically build the plant | Procurement packages, construction drawings, site supervision | 1–3 years (major LNG or nuclear projects can exceed this) |
| ④ Commissioning & Handover | Verify plant performs to design specifications | Commissioning records, performance test reports, as-built documentation | Several months |
Note: Durations represent general guidance for mid-sized projects. Large-scale LNG, nuclear, and offshore projects regularly extend beyond these ranges at every phase.
Isometric drawings are produced in Phase 2 (Detailed Engineering) but directly govern the execution quality of Phase 3 (Construction). This cross-phase dependency is what makes their accuracy and completeness so commercially critical. A drawing error discovered during construction costs 10–50× more to correct than the same error caught in design review.
Phase 2 in Detail: Where the Isometric Bottleneck Forms
Phase 2 is where the majority of engineering labor is consumed. The workflow is:
- Process engineers finalize P&IDs — establishing pipe specifications, line numbers, and process conditions
- Piping designers build the 3D model in Forte 3D, routing each pipeline according to the active pipe class
- Clash detection is run across disciplines (piping, structural, electrical, HVAC)
- Isometrics are extracted from the 3D model
- Each isometric is manually detailed, annotated, and formatted to company standards before issue
Step 5 is where the bottleneck lives. And it is the step that native automation addresses directly.
[Internal link: “How Forte 3D’s PCF-to-Isogen Workflow Works — A Technical Breakdown for Piping Engineers”]
4. Why the Isometric Detailing Phase Consumes 30–50% of Detailed Engineering Time

This is the core question that most project schedules fail to account for correctly. Based on Shinsei Vietnam’s experience supporting multiple EPC plant design projects, the isometric detailing and support drawing phase consistently accounts for 30–50% of total detailed engineering man-hours. On large, high-pressure, or heavily regulated plants (oil and gas, petrochemical, nuclear), this proportion can be even higher.
Three structural reasons explain why.
Reason 1: Volume and Mutual Dependency of Piping Elements
A mid-sized plant model contains thousands of individual pipe segments. A large petrochemical or LNG plant can contain tens of thousands. Each pipe carries multiple parameters — size, material class, specification, routing path, support positions — and every pipe interacts with adjacent equipment, structural steel, electrical cable trays, and instrumentation.
Move one equipment item by 300mm and the connected piping routing changes. Change the routing and the support positions shift. Change the support positions and the support drawings must be regenerated. This cascade of interdependencies means that every design change radiates outward through the isometric drawing package, multiplying revision work across multiple drawings simultaneously.
Reason 2: Large, High-Pressure, and Regulated Plants Amplify the Effect
Oil and gas, petrochemical, and nuclear projects require additional engineering work per pipe that smaller industrial projects do not. Each pipe on a high-pressure steam header or a cryogenic LNG line requires:
- Pressure class verification against the active piping specification
- Thermal expansion and stress analysis integration
- Seismic bracing and support strength calculations
- Regulatory inspection and certification documentation
This additional per-pipe workload means the absolute volume of isometric detailing work scales non-linearly with plant complexity — not just with the number of pipes.
Reason 3: Isometric Detailing Efficiency Directly Impacts Project Margins
Because isometric and support drawing production consumes 30–50% of detailed engineering time, efficiency gains in this phase have a direct and disproportionate impact on total project cost and schedule.
The leverage effect is significant:
| Efficiency Gain in Isometric Detailing | If Isometrics = 30% of Project | If Isometrics = 50% of Project |
| 20% time reduction in detailing | ~6% reduction in total project man-hours | ~10% reduction in total project man-hours |
| 50% time reduction in detailing | ~15% reduction in total project man-hours | ~25% reduction in total project man-hours |
| ~92% time reduction in detailing (Shinsei benchmark, 4 core macros combined) | ~28% reduction in total project man-hours | ~46% reduction in total project man-hours |
Note: Figures represent theoretical leverage calculations applying the detailing reduction rate to the isometric phase proportion. Actual project savings depend on drawing volume, scope of macro application, labor rates, and project-specific conditions.
On a project with a total design scope of 100,000 engineering hours, a 6–10% reduction translates directly to 6,000–10,000 hours of recovered capacity — sufficient to staff multiple additional engineers through peak delivery phases, or to accelerate the schedule by weeks.
5. How Smart 3D Generates Isometric Drawings | The Standard Workflow

Octave Forte 3D — the platform formerly known as Hexagon Smart 3D / Intergraph Smart 3D and commonly referred to as SP3D — is the industry-leading 3D plant design system for large-scale EPC projects. It is a data-centric, specification-driven platform where every piping component carries not just 3D geometry but full engineering data: material grade, pipe schedule, design conditions, insulation requirements, and procurement status — all stored in a shared SQL/Oracle database.
Forte 3D does not draw isometrics natively. Instead, it exports piping data to an external isometric drawing engine through a defined workflow:
| Step | Action | Tool |
| 1 | Pipeline modeled and clash-checked in 3D | Forte 3D |
| 2 | Pipeline data exported as PCF (Piping Component File) format | Forte 3D export function |
| 3 | PCF file read and isometric drawing generated | Isogen® (Octave) |
| 4 | Drawing output in DXF / DWG / PDF format | Isogen® |
| 5 | Drawing manually detailed, annotated, formatted, and reviewed | Engineer — manual work |
The extraction steps (1–4) are largely automated. Step 5 — everything that happens after the raw isometric is generated — is where the bottleneck forms, and where thousands of engineering hours are consumed.
Isogen® is the world’s leading solution for the total automation of piping isometric drawing production and is Octave’s standard system for drawing piping isometrics. It is bundled with Octave Forte 3D and supported by all major piping design software vendors. (Source: Octave — Isogen)
The configuration of Isogen output — drawing border, BOM layout, symbol set, dimension style — is controlled by option switch files. Every EPC company has its own isometric standard, and configuring Isogen to match that standard is a significant one-time setup effort. Once configured, the extraction workflow is consistent. But the post-extraction detailing work remains entirely manual in a standard Forte 3D environment.
[Internal link: “Isogen Configuration for Forte 3D: Option Switches and Drawing Standards Setup”]
6. The Four Manual Stages That Destroy Efficiency After Extraction
Every experienced BIM Manager knows that extracting the raw model is the easy part. The real time cost is in the four detailing stages that follow. Below is a precise breakdown of each stage, with benchmark timing from Shinsei Vietnam internal measurements.
Stage 1: Support Attachment to Isometrics — InputSupportAttach
After the raw isometric is extracted, each pipe support position must be individually attached to the drawing. In the standard Forte 3D out-of-the-box workflow:
- Each pipeline must be opened individually
- Attachment constraints must be manually configured per support position
- There is no native batch processing — every support position is handled one at a time
Benchmark (6 support positions, multiple pipelines):
| Manual | Shinsei Automation | |
| Time | 12.0 min | 0.5 min |
| Steps | 30 | 3 |
| Time saved | — | 11.5 min (95.8% faster) |
On a project with 5,000 pipe supports, this single sub-task alone could consume over 1,000 engineering hours before a single line of engineering judgment is applied.
Stage 2: Control Point Detailing — AddControlPointToSupport
Support drawings require precise control point (CP) annotations for on-site fabrication. A typical support drawing requires:
- Elevation CPs — confirming vertical position of the support relative to a datum
- Dimension CPs — confirming horizontal offsets from structural centerlines
- Origin CPs — establishing the reference origin for the support assembly
In the default Forte 3D workflow, adding control points is entirely manual: each drawing opened individually, each CP type added in sequence, one drawing at a time with no batch capability.
Benchmark (12 CPs per drawing: 5 Elevation + 6 Dimension + 1 Origin):
| Manual | Shinsei Automation | |
| Time | 24.0 min | 1.0 min |
| Steps | 60 | 3 |
| Time saved | — | 23.0 min (95.8% faster) |
At 5,000 supports requiring full CP detailing, manual control point work alone could consume over 2,000 engineering hours — an entire engineer-year of labor spent on a single annotation sub-task. Automation eliminates this overhead regardless of batch size.
Stage 3: Label Alignment and Drawing Formatting — AlignLabel
Once support data is added, drawings must be formatted to company and client standards before issue:
- Labels rearranged so they do not overlap pipe run annotations
- Standardized titles, detail callouts, and revision blocks added
- Uniform label spacing enforced across all drawings in the package
Without automation, this work is done manually by each individual drafter — introducing variability across the drawing package. Labels drift. Titles are inconsistently placed. QA reviewers catch formatting errors that require rework and re-issue cycles.
Benchmark (1 support drawing):
| Manual | Shinsei Automation | |
| Time | 3.0 min | 0.1 min (6 sec) |
| Steps | 6 | 2 |
| Time saved | — | 2.9 min (96.6% faster) |
Stage 4: Drawing Scale Configuration — DwgSupportScale
Each support drawing must be set to the correct scale before issue. In the default Forte 3D workflow, the engineer manually selects a scale factor, verifies the drawing fits within the border, and adjusts if necessary.
Benchmark (1 support drawing):
| Manual | Shinsei Automation | |
| Time | 5.0 min | 2.0 min |
| Steps | 7 | 9 (+2 steps, net faster) |
| Time saved | — | 3.0 min (60.0% faster) |
Note: DwgSupportScale adds 2 net operational steps versus manual. However, those are automated system actions — not manual engineer effort — and total completion time is still 60% faster.
The Compounded Cost: All Four Stages Combined
| Stage | Manual Time | Manual Steps | Macro | Automated Time | Automated Steps |
| Support Attachment (6 positions) | 12.0 min | 30 | InputSupportAttach | 0.5 min | 3 |
| Control Point Detailing (12 CPs) | 24.0 min | 60 | AddControlPointToSupport | 1.0 min | 3 |
| Label Alignment (1 drawing) | 3.0 min | 6 | AlignLabel | 0.1 min | 2 |
| Drawing Scale Setting (1 drawing) | 5.0 min | 7 | DwgSupportScale | 2.0 min | 9 |
| Total per drawing package | 44.0 min | 103 steps | — | 3.6 min | 17 steps |
| Efficiency gain | — | — | — | 91.8% net faster | 83.5% fewer manual steps |
On a 2,000-drawing EPC package, the manual total compounds to approximately 1,467 hours of pure detailing effort. This is before a single line of engineering judgment — stress analysis, clash resolution, constructability review — has been applied.
7. Why Generic Automation Tools Fail in Forte 3D (Smart 3D) Environments
The immediate response to this inefficiency is often to evaluate third-party automation plugins or generic CAD scripts. These tools are widely available, frequently affordable, and look compelling in vendor demonstrations. In real Forte 3D production environments, they consistently fail for three fundamental structural reasons.
Failure Mode 1: The PCF/IFC Export-Import Problem
Generic tools cannot operate inside the Forte 3D database. They require engineers to export pipeline data as PCF or IFC files, process them externally, and re-import the results. Every round-trip translation strips metadata — breaking parametric relationships, losing spec-driven attributes, and requiring hours of manual re-linking to restore drawing-model consistency after each processing cycle.
Failure Mode 2: Fatal Errors at Mega-Project Scale
Forte 3D runs on a massive SQL/Oracle database that may contain tens of thousands of piping elements, equipment objects, and structural components. Generic plugins are built for light-duty CAD environments. When forced to process large batches of Forte 3D data without native API access, they encounter memory overloads and fatal errors — crashing mid-process and wiping unsaved work. On a mega-project, a single fatal error event can set a production team back by hours.
Failure Mode 3: Specification Blindness
Forte 3D’s piping specifications are the engineering foundation of the entire design model. Every component — every elbow, valve, support, and flange — is placed according to strict material class rules governing size, temperature rating, pressure class, and end preparation. Generic tools are geometry-driven: they place shapes into spaces without reading these specifications. The result is geometrically-positioned but specification-non-compliant outputs — drawings that fail QA/QC review and must be manually corrected before issue.
| Issue | Generic Plugin | Shinsei Native Macro |
| Operates inside Forte 3D database | ✗ — requires export/import | ✓ — native API |
| Reads active piping specification | ✗ — geometry only | ✓ — spec-driven logic |
| Batch processing at mega-project scale | ✗ — memory leak risk | ✓ — stable, no crashes |
| Preserves metadata and parametric relationships | ✗ — lost in translation | ✓ — zero data loss |
| Single-window execution in Forte 3D UI | ✗ — external application | ✓ — inside Forte 3D |
Key principle: Forte 3D’s parametric, spec-driven architecture is precisely what makes it the industry standard for large EPC projects. Any automation tool that bypasses that architecture — rather than working within it — will always produce inferior output. There is no shortcut around native development. (Reference: Octave — Forte 3D Interoperability White Paper)
8. Native Automation | Benchmark Data and Real Efficiency Gains

The solution is not a faster generic tool. It is automation that runs natively inside the Forte 3D database — using the same API that Forte 3D uses to read and write piping objects. No PCF export. No IFC roundtrip. No external application.
Shinsei Vietnam’s macro suite is built exclusively for Octave Forte 3D. Every macro executes entirely within the Forte 3D user interface, operating directly on the live project database.
Core Macro Performance Data
All figures derived from Shinsei Vietnam internal time-and-motion measurements on real Forte 3D project environments.
| Macro | Function | Manual Time / Steps | Automated Time / Steps | Efficiency Gain |
| InputSupportAttach | Support attachment to isometrics (6 positions, multiple pipelines) | 12.0 min / 30 steps | 0.5 min / 3 steps | 95.8% faster, 90% fewer steps |
| AddControlPointToSupport | Control point detailing (12 CPs per drawing) | 24.0 min / 60 steps | 1.0 min / 3 steps | 95.8% faster, 95% fewer steps |
| AlignLabel | Label and title alignment (1 support drawing) | 3.0 min / 6 steps | 0.1 min / 2 steps | 96.6% faster, 66.6% fewer steps |
| DwgSupportScale | Drawing scale configuration (1 support drawing) | 5.0 min / 7 steps | 2.0 min / 9 steps | 60.0% faster |
| Combined (all 4 macros) | Full drawing package workflow | 44.0 min / 103 steps | 3.6 min / 17 steps | 91.8% net time reduction |
What Native Architecture Delivers That External Tools Cannot
Specification-Driven Logic: The engine reads the active piping specification directly from the Forte 3D database. Support placement, CP configuration, and drawing validation all apply the exact material class rules, pipe size constraints, and temperature parameters that a senior engineer would apply manually — instantaneously and without error.
Batch Processing Without Instability: Because macros run inside Forte 3D’s native memory environment, they can process hundreds of drawings and thousands of support elements simultaneously without triggering the memory leaks and crashes that plague external tools.
Zero Data Translation Risk: Project data never leaves the Forte 3D environment. No metadata is lost. No parametric relationships are broken. The database remains intact — with the target task completed correctly and completely.
Single-Window Execution: Engineers execute macros from one interface window within Forte 3D — eliminating context-switching between multiple applications and the associated cognitive load and error risk.
[Internal link: “Shinsei Vietnam 16-Macro Suite — Full Capability Overview and Technical Architecture”]
9. The Compounding ROI | What Automation Means at Project Scale
Individual macro benchmarks show impressive per-drawing gains. The real business case for automation, however, is what those gains compound to across an entire project.
Illustrative ROI Model: 2,000-Drawing EPC Project
Model assumptions: 2,000 support drawings and isometrics requiring the full 4-macro workflow. Average loaded engineering labor rate: $80 USD/hour. Actual results will vary based on drawing volume, labor rates, scope of macro application, and project-specific workflow conditions.
| Scenario | Total Time | Total Cost | Primary Engineer Activity |
| Manual Workflow | ~1,467 hours | ~$117,360 | Clicking, dragging, manually configuring each drawing |
| Shinsei Automated | ~120 hours | ~$9,600 | Batch processing, QA review, engineering coordination |
| Savings | ~1,347 hours | ~$107,760 (~92%) | Hours redirected to high-value engineering work |
Note: This is a projected cost model, not a guaranteed outcome. The $80/hr figure is a representative mid-range rate for senior piping designers. Adjust for your region and seniority level. Actual savings depend on the proportion of drawings requiring each macro workflow.
Leverage Effect: How Detailing Automation Impacts Total Project Cost
| Automation Efficiency Gain | If Isometrics = 30% of Project | If Isometrics = 50% of Project |
| 20% time reduction in detailing | ~6% total project reduction | ~10% total project reduction |
| 50% time reduction in detailing | ~15% total project reduction | ~25% total project reduction |
| 91.8% reduction (Shinsei 4-macro combined) | ~28% total project reduction | ~46% total project reduction |
Note: Figures represent theoretical leverage calculations. Actual impact depends on project scale, macro coverage scope, and workflow conditions.
Where the Recovered Hours Go
The ~1,347 recovered hours on a 2,000-drawing project are a capacity unlock, not just a cost saving. Senior piping engineers redirect that time to:
- Multi-discipline clash resolution — catching structural and electrical interferences before construction
- Constructability reviews — optimizing spool break strategies to maximize shop welds and reduce field labor cost
- Specification optimization — reviewing support selections for weight compliance, thermal expansion, and stress requirements
- Client coordination — faster response to RFIs and scope change requests during peak delivery
In fixed-price EPC contracts, where project profit margins are typically in the single-digit percentage range, protecting 1,300+ hours of senior engineering capacity per project is not a workflow optimization. It is a margin protection strategy.
[Internal link: “Download Free — The Smart 3D ROI Report: Protecting EPC Profit Margins Through Native Automation”]
10. Implementation Checklist for BIM Managers
If you are evaluating isometric drawing automation for a Smart 3D environment, the following checklist covers the key technical and organizational factors to assess before deployment.
Technical Prerequisites
- [ ] Confirm Smart 3D version compatibility with the macro suite
- [ ] Verify SQL/Oracle database environment meets deployment specifications
- [ ] Map your active piping specifications — the automation engine reads these directly
- [ ] Identify which drawing packages have the highest manual detailing volume (prioritize for maximum early ROI)
- [ ] Document your company drawing standards that AlignLabel configuration will need to replicate
Workflow Assessment
- [ ] Baseline your current manual time per drawing for each of the 4 core workflow stages
- [ ] Identify peak-load periods — when do manual bottlenecks create the most schedule pressure?
- [ ] Assess the scale of your control point requirements — projects with high CP volume gain the most from AddControlPointToSupport
- [ ] Review the proportion of drawings requiring full CP packages vs. partial configurations
Implementation Phases
| Phase | Action | Outcome |
| Phase 1 | Infrastructure assessment — server environment and Smart 3D database review | Compatibility confirmed, no architecture changes required |
| Phase 2 | Workflow mapping — translate piping specs and drawing standards into macro rulesets | Automation logic configured to your project standards |
| Phase 3 | Integration and training — minimal learning curve, macros run inside the S3D UI | Team operational on first drawing package |
| Phase 4 | Scale — pilot drawing package to full project deployment | Full project throughput improvement realized |
Red Flags to Avoid When Evaluating Any Automation Tool
- Any tool requiring PCF or IFC export from Smart 3D before processing
- Any plugin not built on Smart 3D’s native API
- Any vendor that cannot demonstrate batch processing on a database matching your project’s scale
- Any tool that cannot read your active piping specification for support validation
[Internal link: “Book a Live Technical Demo — See Shinsei Macros Run on Your Actual Smart 3D Project Data”]
11. References and Further Reading
Understanding Piping Isometrics
- Piping Isometrics: How to Read and Understand Them — Projectmaterials.com: A detailed technical guide to isometric drawing structure, spool breaks, BOM composition, and fabrication workflows.
- Smart Piping Isometrics: The Digital Future — Know Piping Engineering: Covers the evolution from manual isometric drafting to 3D-integrated digital workflows and intelligent P&IDs (January 2026).
Hexagon Smart 3D Platform
- Smart 3D (SP3D) Plant Design — Complete Technical Guide — Projectmaterials.com: Comprehensive breakdown of Smart 3D architecture, the PCF/Isogen workflow, and downstream fabrication integration.
- Intergraph Smart® Isometrics — Official Product Page — Hexagon: Overview of Smart Isometrics and its role in the Digital Isometric Value Chain.
- Isogen® — Official Product Page — Hexagon: The industry-standard isometric drawing engine bundled with Smart 3D.
- Hexagon Smart 3D Interoperability White Paper — Hexagon: Technical reference on Smart 3D database architecture and data translation limitations.
EPC Automation
- SmartPlant Spoolgen: The Future of Automated Piping Isometric Production — Multisoft Virtual Academy: Overview of fabrication-level isometric automation from Smart 3D data sources.
Shinsei Vietnam Resources
- [Download Free White Paper: Eliminating Manual Bottlenecks in EPC Plant Design — The 2026 Guide to Smart 3D Automation]
- [Download Free White Paper: Manual Drafting vs. Native Automation — The Ultimate Guide to Automated Isometrics in Smart 3D]
- [Download: Shinsei Vietnam 16-Macro Solution Catalog] — Full capability overview of all 16 native Smart 3D macros
- [Book a Live Technical Demo] — See Shinsei macros run on your actual Smart 3D project data
12. FAQ
Q1. What is the difference between a piping isometric and a P&ID?
A P&ID (Piping and Instrumentation Diagram) is a schematic that shows process flow, equipment relationships, and control logic — it communicates what the plant does. A piping isometric is a construction document that shows exact pipe routing, component locations, dimensions, and weld positions — it tells the fabricator how to physically build each pipeline. P&IDs are produced in basic engineering; isometrics are produced in detailed engineering and used directly in fabrication and construction.
Q2. Why does Smart 3D use Isogen instead of generating isometrics natively?
Smart 3D exports pipeline data in PCF (Piping Component File) format to Isogen®, Hexagon’s dedicated isometric drawing engine. Isogen is highly configurable — each EPC company sets up option switch files and style files that govern drawing border, BOM layout, symbol sets, and dimension styles to match their specific standards. This separation allows Smart 3D to focus on intelligent 3D modeling while Isogen handles the drawing production and formatting layer. Isogen is bundled with Smart 3D and is the industry standard engine used by virtually all major piping design platforms.
Q3. Why does isometric detailing consume 30–50% of detailed engineering time?
Three factors compound: (1) the sheer volume of piping elements — mid-sized plants have thousands of pipes, large plants tens of thousands — each requiring individual detailing; (2) mutual dependency between pipes, equipment, structural steel, and electrical elements, meaning every design change cascades into drawing revisions across the package; (3) for high-pressure, large-scale, or heavily regulated plants (oil and gas, nuclear, LNG), additional engineering per pipe — stress analysis, seismic bracing, regulatory certification — further inflates the work per isometric. These factors together make isometric detailing the largest single work category in detailed engineering.
Q4. Can generic CAD plugins automate Smart 3D isometric workflows?
Generic plugins consistently fail in real Smart 3D environments for three reasons: they require PCF/IFC export-import cycles that strip metadata and break parametric relationships; they are not built for Smart 3D’s SQL/Oracle database scale and cause memory errors when processing large batches; and they are geometry-driven, placing components without reading the project’s active piping specification, which causes QA/QC failures. Only tools built on Smart 3D’s native API can process the database directly, read piping specifications, and handle mega-project scale without instability.
Q5. What are the most time-consuming manual stages in Smart 3D isometric production?
Based on Shinsei Vietnam benchmark measurements, the four highest-impact manual stages are: (1) support attachment configuration — 12 minutes and 30 steps per 6 positions (InputSupportAttach); (2) control point detailing — 24 minutes and 60 steps per 12 CPs (AddControlPointToSupport); (3) label alignment — 3 minutes and 6 steps per drawing (AlignLabel); (4) drawing scale setting — 5 minutes and 7 steps per drawing (DwgSupportScale). Combined, these four stages consume 44 minutes and 103 steps per drawing package manually, compared to 3.6 minutes and 17 steps with native automation.
Q6. Can Shinsei macros be used for disciplines other than piping — structural, electrical, instrumentation?
The model input macros (support input, positioner input, control point detailing) are designed specifically for piping and pipe support workflows within Smart 3D. They are not applicable to structural, electrical, or instrumentation design phases. However, the drawing-related macros (AlignLabel, DwgSupportScale, CreateGridSymbol) operate on Smart 3D drawing outputs and can, with appropriate configuration customization, be applied to drawing formatting tasks in other disciplines. The practical focus — and where the ROI is largest — is the piping design phase.
Q7. How long does implementation take, and does it disrupt ongoing projects?
Shinsei macros are native Smart 3D add-ons — they install without changes to the core database architecture or existing project data. There is no database migration, no workflow overhaul, and no project downtime required during deployment. Implementation follows a four-phase methodology: infrastructure assessment, workflow mapping (translating your piping specs and drawing standards into macro rulesets), integration and training (minimal, as the macros run inside the Smart 3D interface your team already uses), and scaling from pilot to full deployment. For a mid-sized EPC team, pilot deployment on an active drawing package is typically achievable within weeks.
Q8. What is the $107K savings figure based on, and how accurate is it for my project?
The $107,760 savings figure is derived from an illustrative cost model: 2,000 support drawings × 44 minutes manual detailing per drawing ÷ 60 × $80/hour loaded engineering rate = ~$117,360 manual cost, versus 2,000 drawings × 3.6 minutes automated × $80/hour = ~$9,600 automated cost. The difference is ~$107,760. This is a modeled projection, not a guaranteed outcome. Variables that affect your actual figure include: drawing volume, the proportion of drawings requiring each macro workflow, your local engineering labor rate, and project-specific conditions. Shinsei Vietnam provides customized ROI analyses based on actual project scope — [contact us to request one].
Shinsei Vietnam is a specialist Smart 3D automation partner, part of Tatsusei Giken. Our 16-macro suite is built exclusively for Hexagon Smart 3D using native API integration. We serve EPC firms globally on oil and gas, petrochemical, LNG, and industrial plant projects.